A practice calls its agency in a panic. Organic traffic is down forty percent. Something is broken. Fire someone.
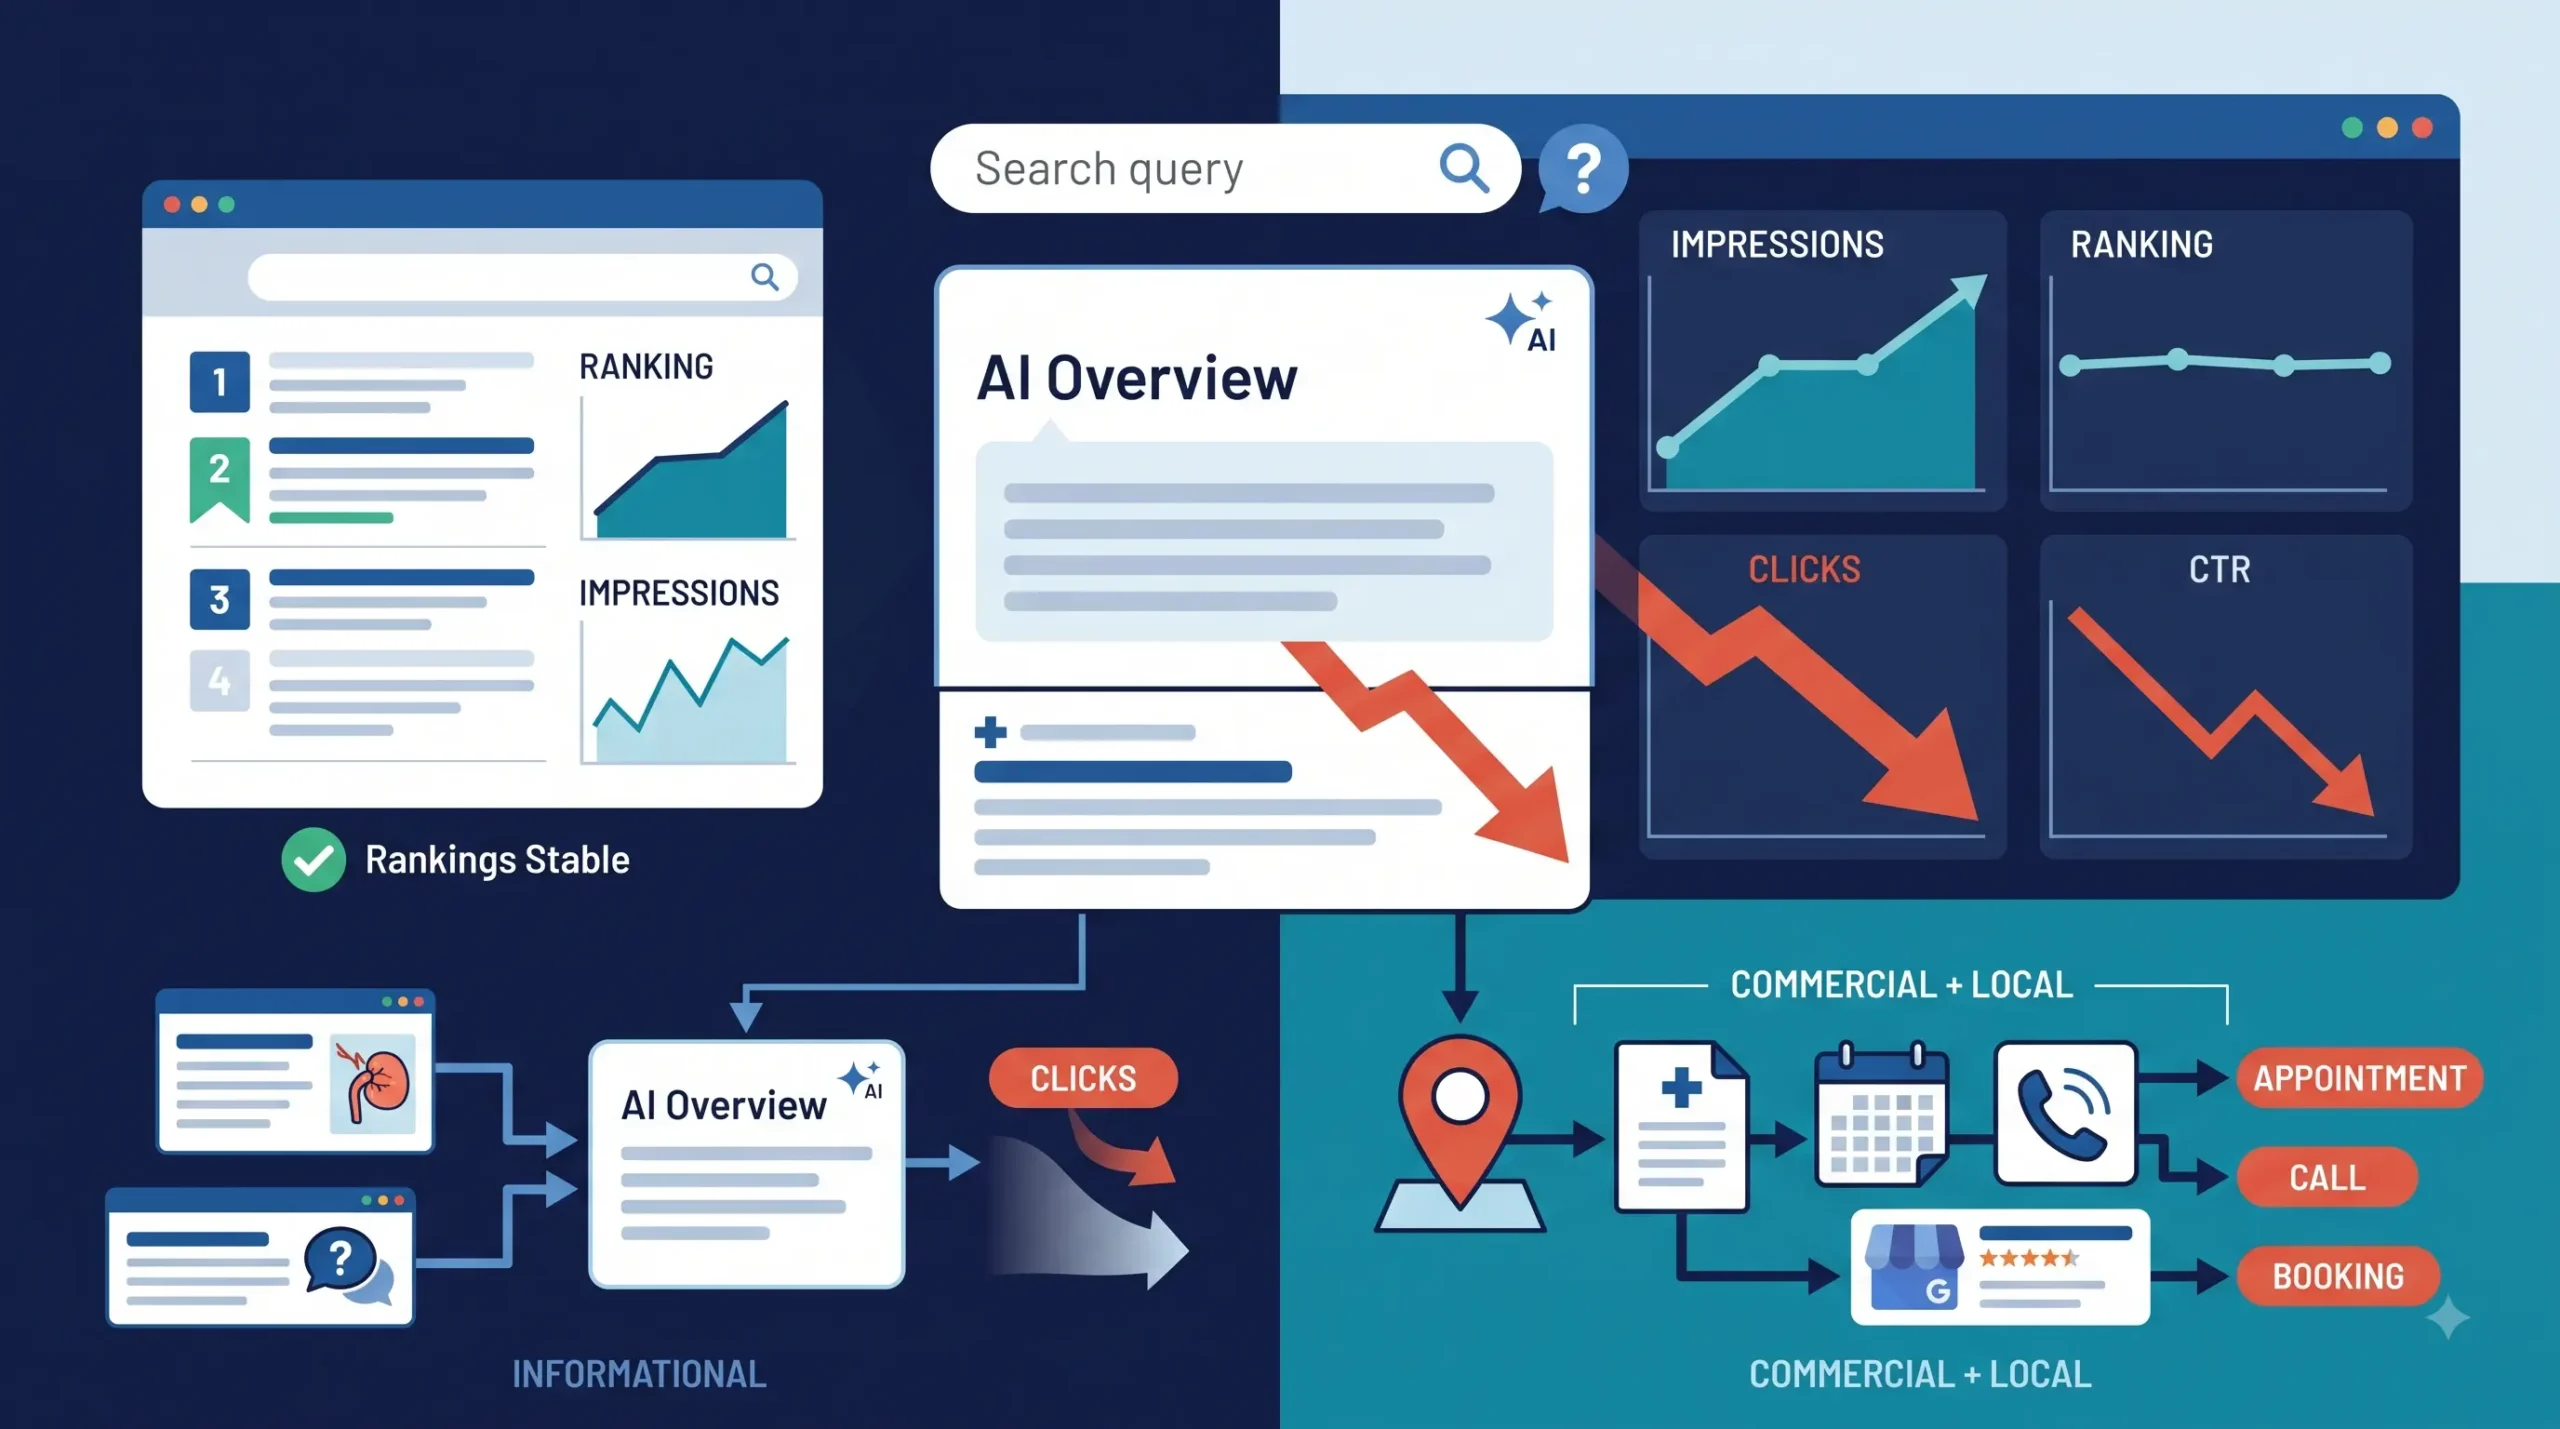
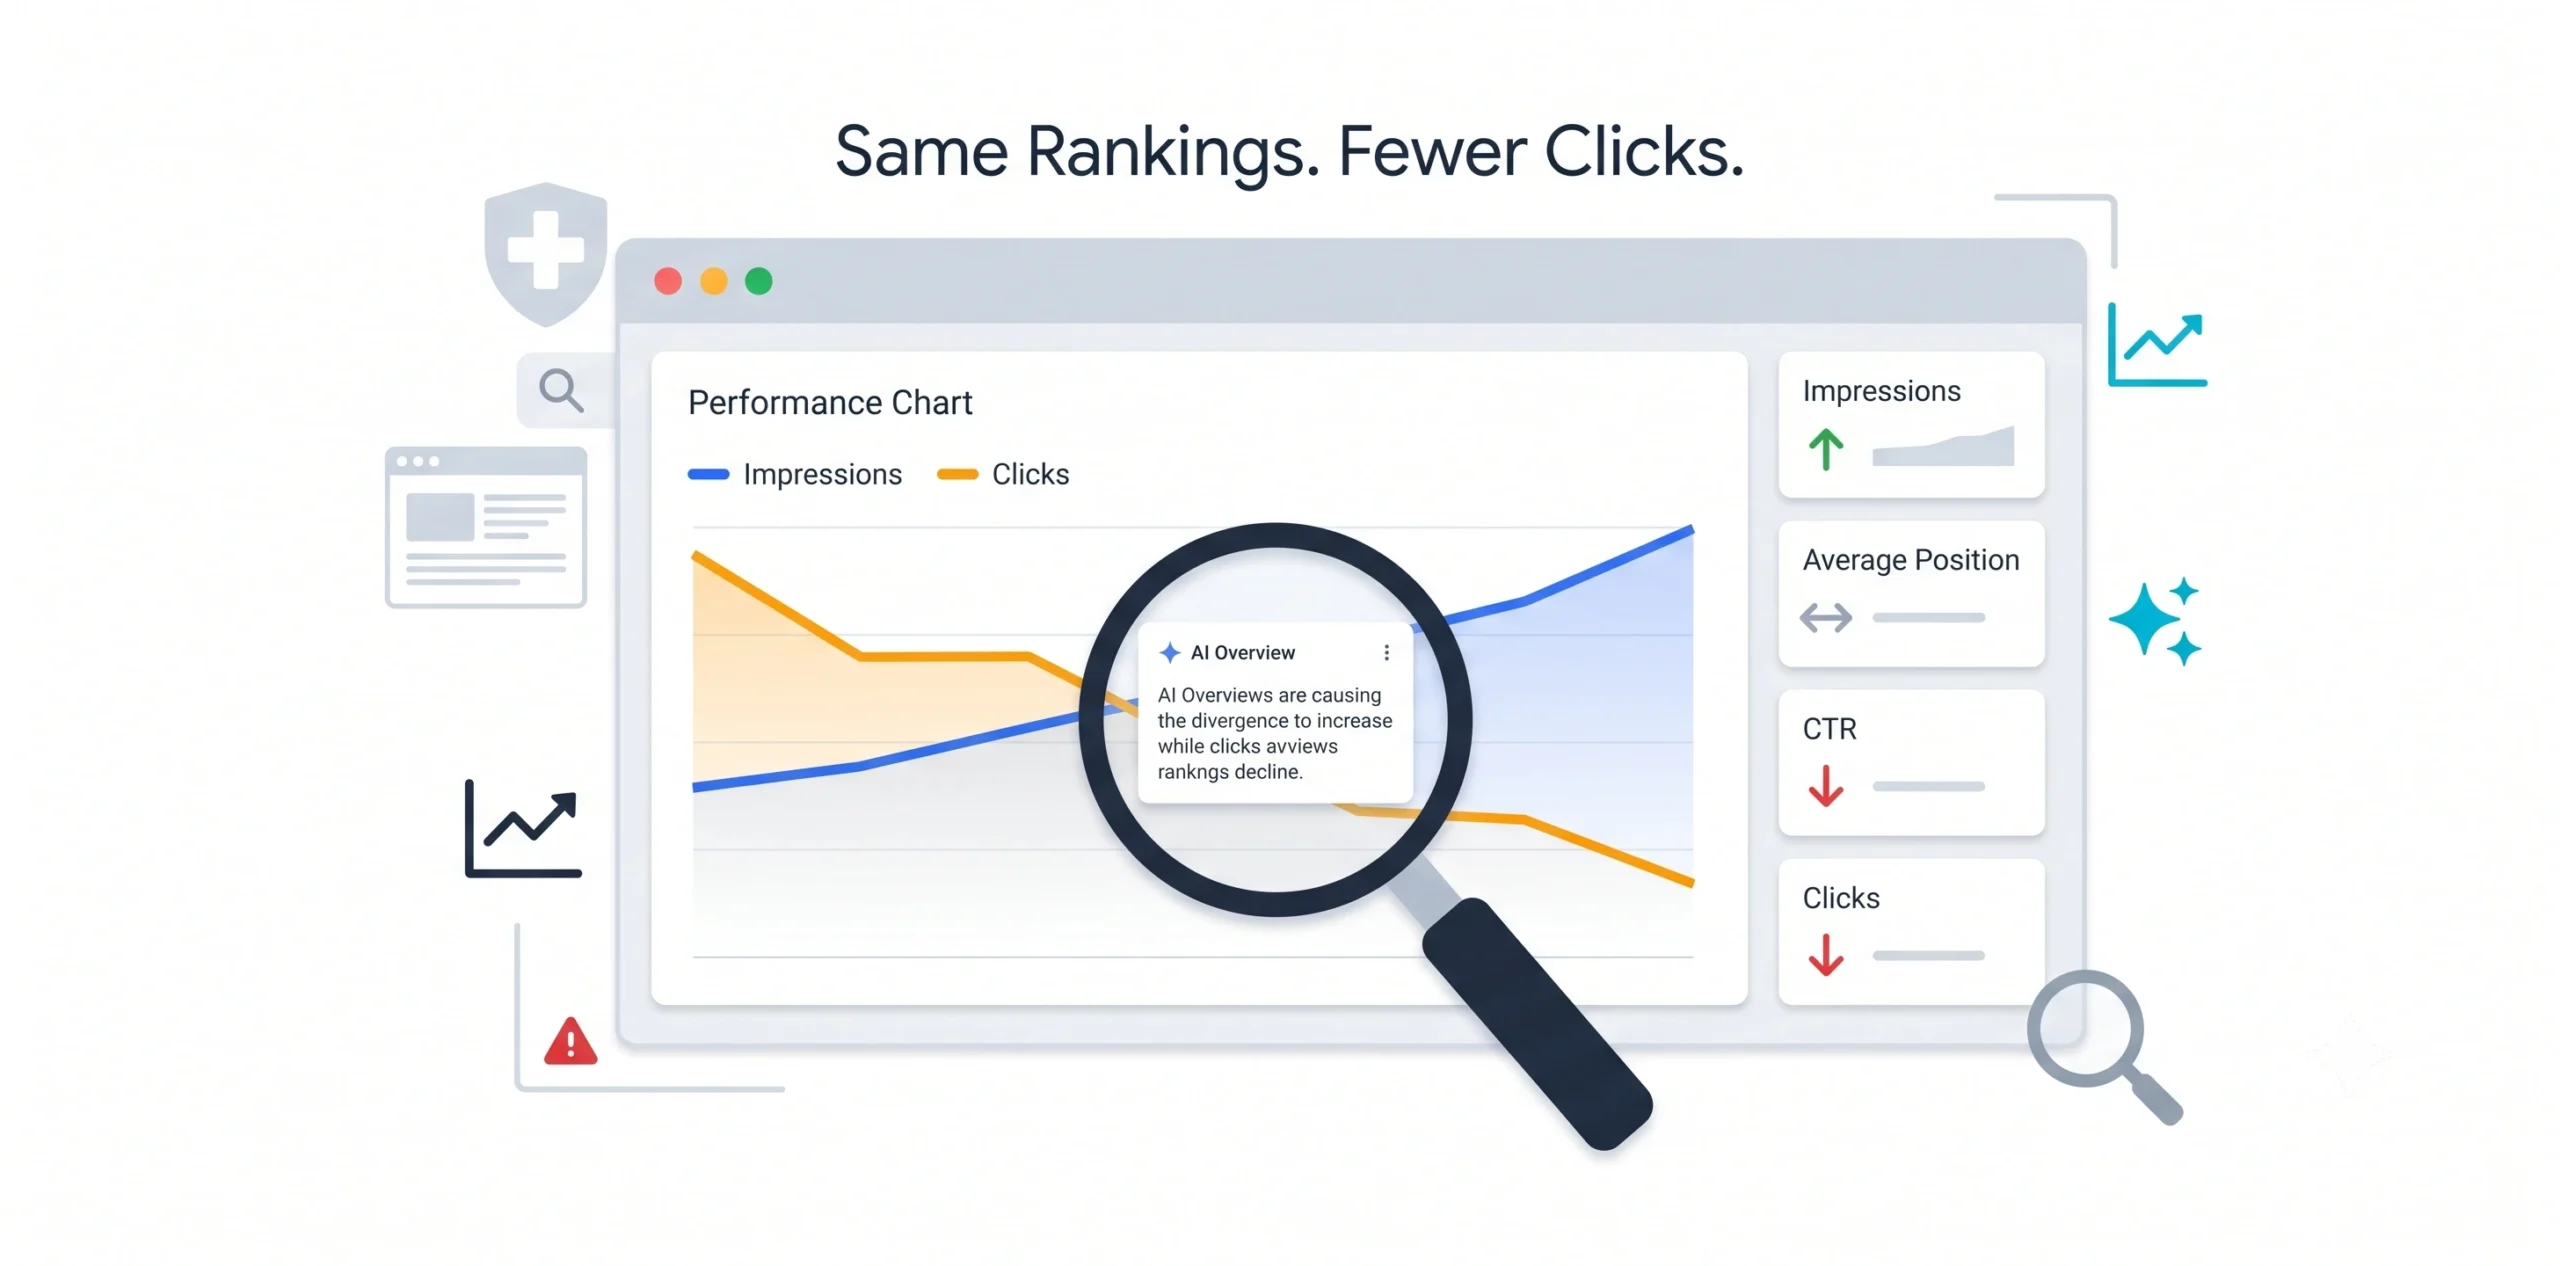
Then you open Search Console and the picture makes no sense. Impressions are up. Average position improved. The rankings did not move, or they got better. Only the clicks collapsed.
That shape is not a penalty, and treating it like one wastes a quarter chasing a problem that does not exist. It is the signature of AI Overview interception, and healthcare is the most exposed vertical on the web to it. This post covers how to confirm the diagnosis from your own data, how to separate the losses you can recover from the ones you cannot, and what to actually do about each.
Why healthcare got hit first and hardest
AI Overviews roll out fastest where answers are informational and consensus-based, which describes most health queries. Reporting from BrightEdge puts AI Overview coverage on healthcare queries around 88 to 89%, higher than any other major vertical, with treatment and procedure queries approaching full coverage. [STAT CHECK: BrightEdge figures reported via secondary sources. Verify against BrightEdge’s own published data before publishing.]
The click effect is documented by several independent studies, and this is where most articles on the topic go wrong, so it is worth being precise.
Pew Research Center ran a behavioral study of nearly 69,000 real Google searches and found that when an AI summary appeared, users clicked a traditional result 8% of the time, against 15% when no summary appeared. Pew also found that roughly a quarter of sessions ended entirely after an AI Overview, and that users clicked a link inside the summary about 1% of the time. Ahrefs, measuring 300,000 keywords against Search Console data, found AI Overview presence correlated with 58% lower click-through on the top-ranking page. Seer Interactive, tracking the longest time series, documented healthcare click-through falling from roughly 1.6% to 0.6% when an AI Overview is present.
Those three numbers are not the same measurement and should not be averaged. Pew measured browsing behavior across users. Ahrefs measured click-through on the top-ranking page for AI Overview keywords. Seer tracked a time series at the account level. Media coverage routinely blends them into a single “traffic is down 58%” claim, which is not what any of them found. [STAT CHECK: verify all three study figures against original publications before publishing. This distinction is the credibility anchor of the post; do not soften it.]
What they agree on is direction and rough magnitude: when an AI Overview appears, roughly half or fewer of the previous clicks arrive. For a vertical where nearly nine in ten queries trigger one, that is a structural change, not a fluctuation.
Confirming the diagnosis in Search Console
Fifteen minutes of data work settles whether this is your problem.
Step 1: compare the right periods. Pull a 28-day window against the prior 28 days, then the same window against the same period last year. Year-over-year matters because seasonality in healthcare is real.
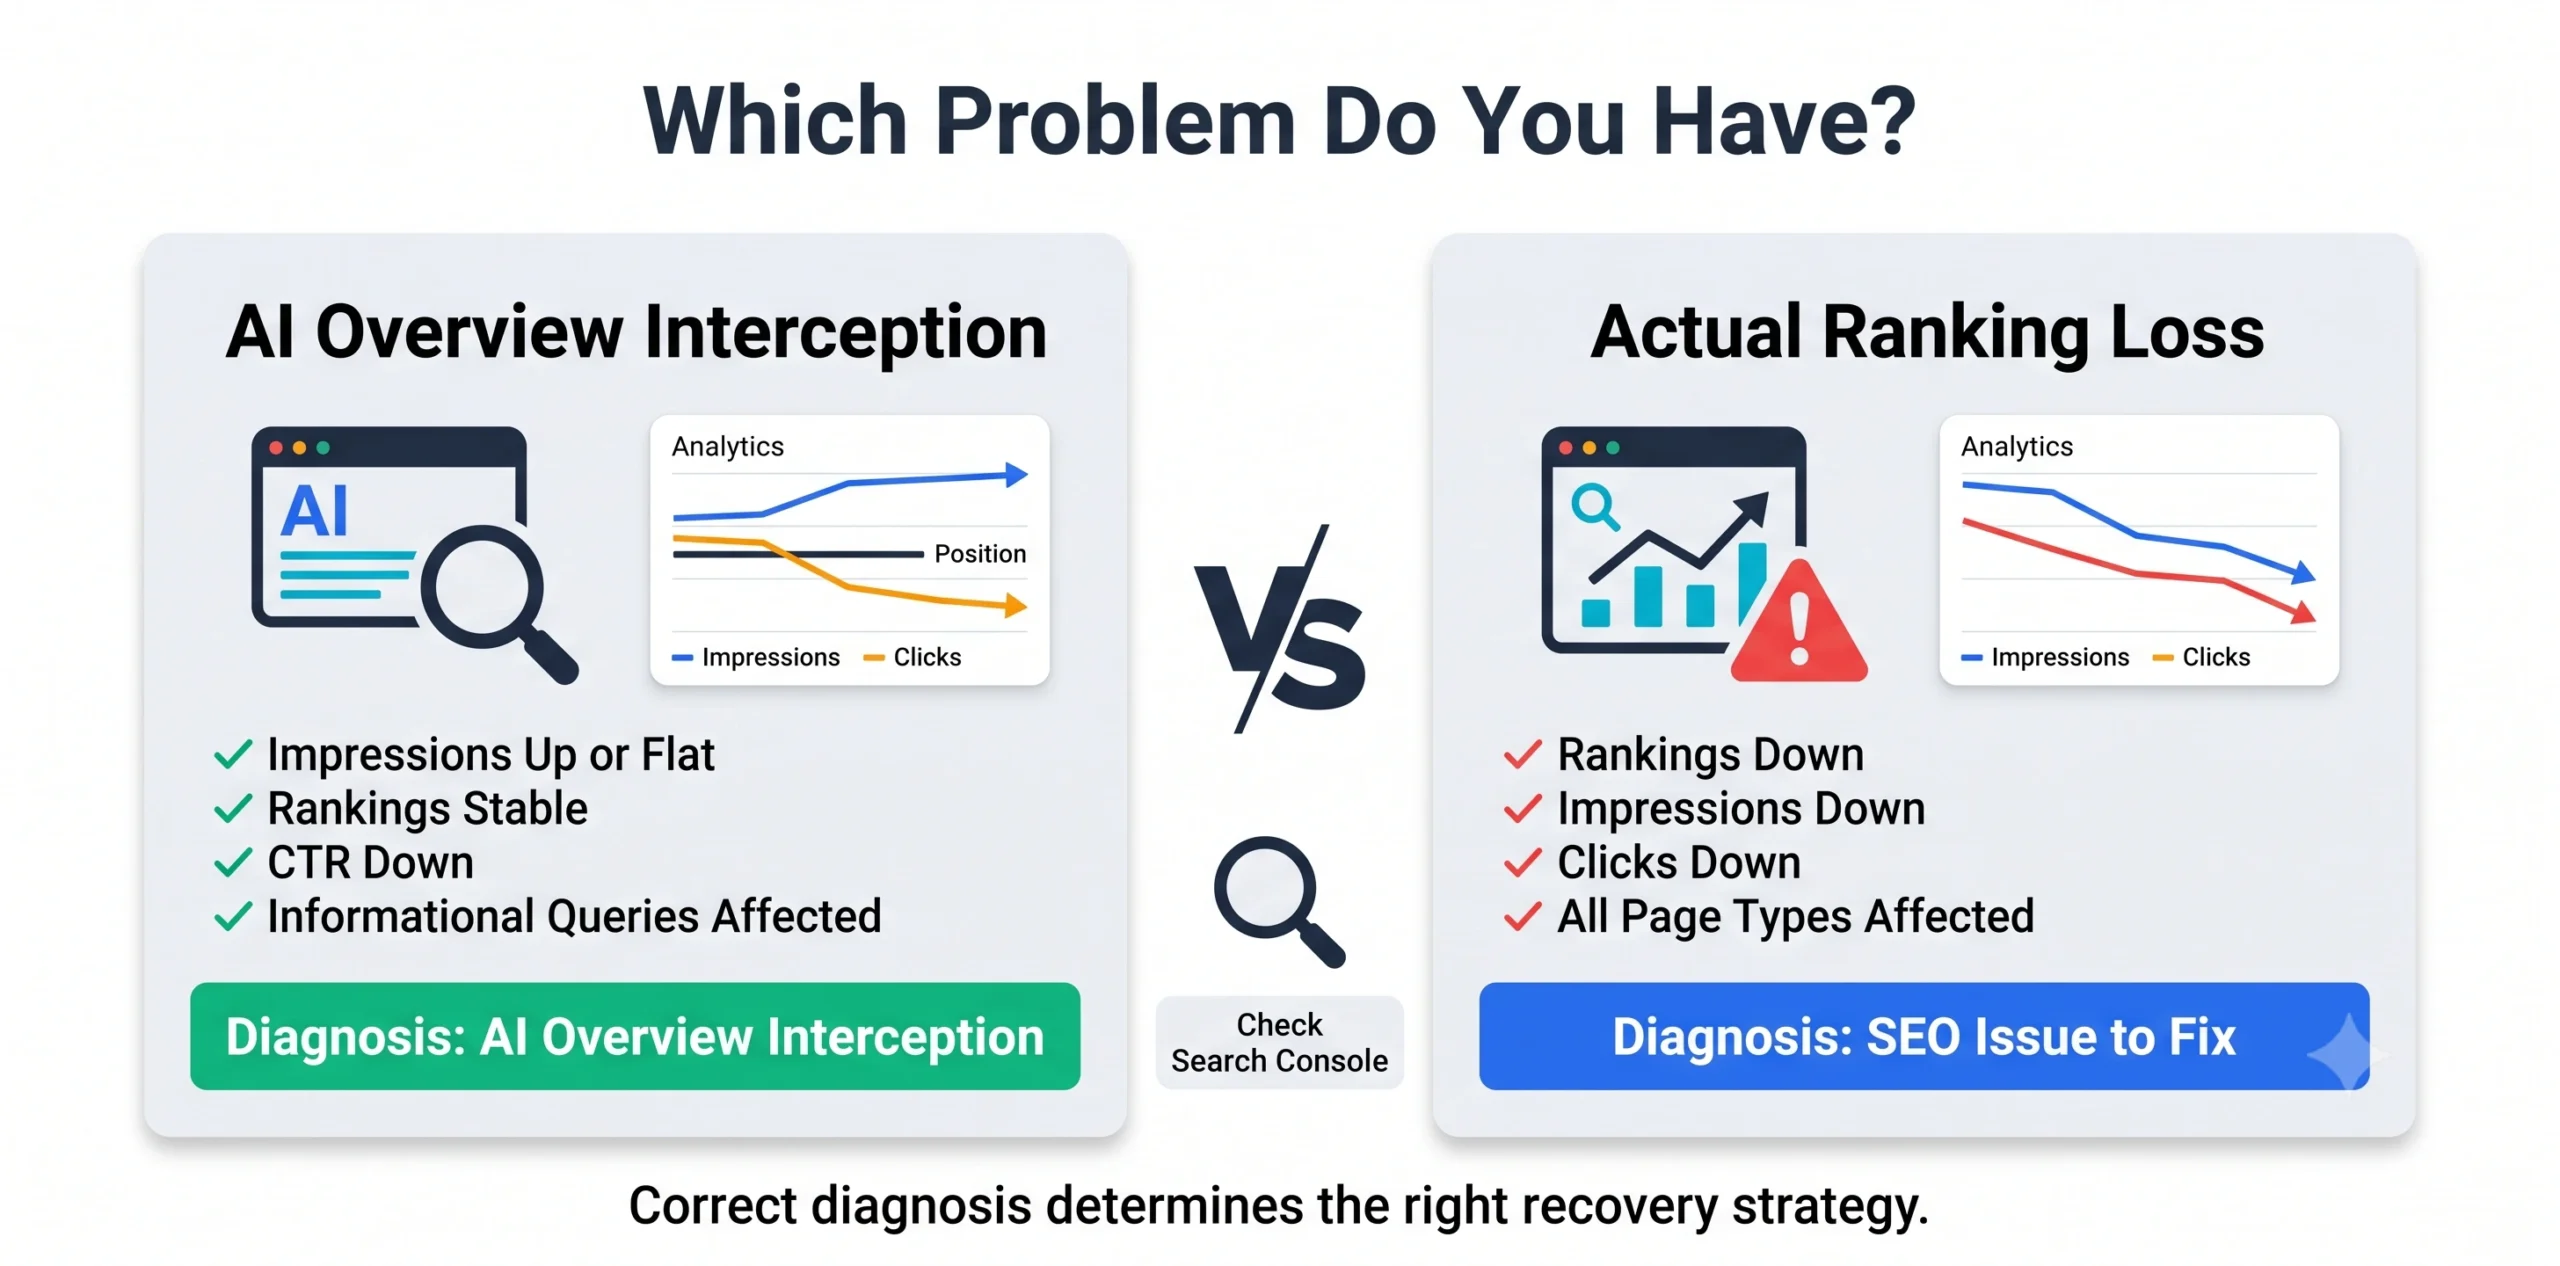
Step 2: look for the divergence shape. The AI Overview signature is impressions flat or rising, average position flat or improving, and clicks and click-through rate falling. A true ranking loss looks different: position worsens and impressions fall alongside clicks.
Step 3: split the data by page type. This is the step most people skip and it determines everything that follows. Filter your query and page data into informational pages, meaning condition explainers and symptom content, versus commercial pages, meaning service pages, location pages, and provider pages.
Step 4: check the queries themselves. Take your top twenty declining queries and search them. Note which ones return an AI Overview. If your losses concentrate on the ones that do, the diagnosis is confirmed.
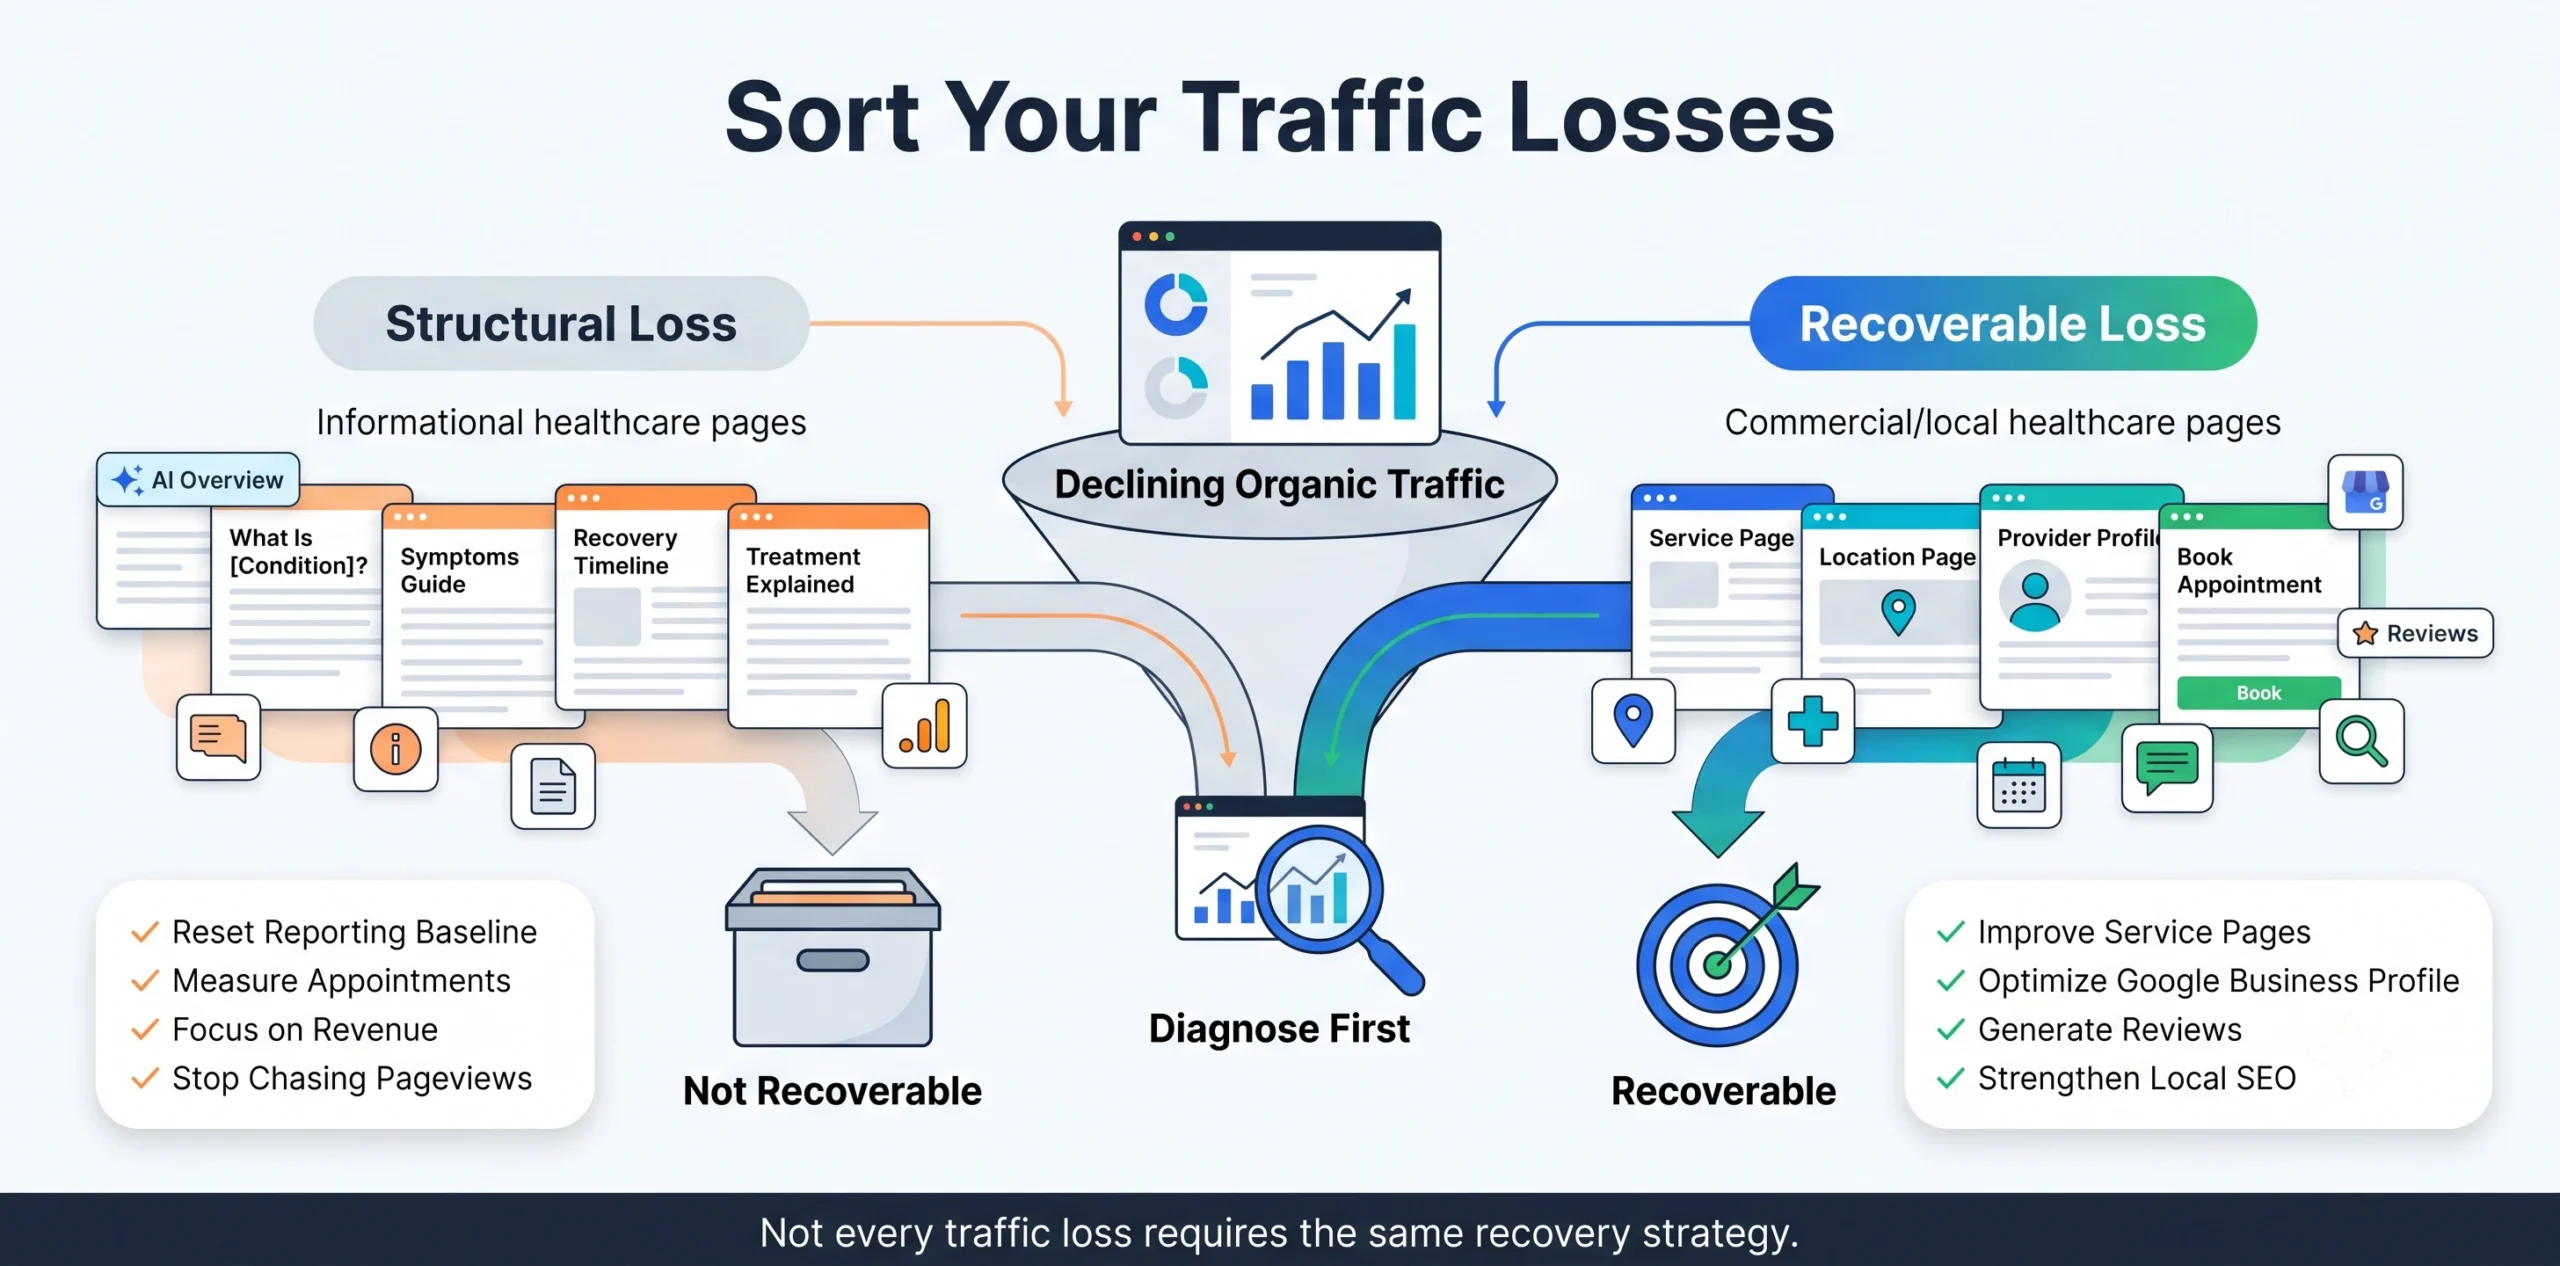
Structural loss versus recoverable loss
Once the data is split, the losses sort into two piles with very different prognoses.
Structural loss. Traffic to condition explainers, symptom pages, and general clinical information. Someone searching what recovery from a procedure typically involves now gets the answer on the results page. That click is not coming back, and no amount of rewriting retrieves it. This also means the content strategy that produced those pages was already weak, for reasons we covered in our post on why practices should stop competing with health publishers.
Recoverable loss. Traffic to service pages, location pages, and provider-seeking queries. AI Overviews touch local commercial queries far more lightly, because a summary cannot tell someone which nearby practice takes their insurance and has an opening Thursday. If your commercial pages are down, that is a real SEO problem with real fixes, and AI Overviews are not the culprit.
The practical implication is uncomfortable but clarifying. A large share of what practices are mourning was traffic that never converted. Losing informational visitors who were never going to book is a reporting problem, not a business problem. Losing service page traffic is a business problem. Diagnose which one you have before spending anything.
There is a small consolation in the structural pile. The clicks that survive an AI Overview tend to come from readers who already saw the summary and wanted more, which means higher intent per visit even at lower volume.
What to do about each
For structural loss, stop measuring what no longer exists. Reset the baseline. Report on conversions, calls, booked appointments, and revenue by channel rather than sessions. A practice measuring itself on pageviews in 2026 will look like it is failing while its appointment book fills.
Defend the commercial queries hard. Complete service pages for every service at every location, an optimized Google Business Profile, current reviews, and strong local signals. This is the traffic that books patients and the traffic AI Overviews barely reach.
Compete for citation instead of clicks. If the summary is going to appear, being the source it names has value: brand exposure, a share of the small click volume that does flow through, and credibility with the patients who do click. Content that gets cited tends to be clearly structured, directly answers the question near the top, carries visible author credentials, and cites primary sources. That is the same E-E-A-T infrastructure we covered in the core update post, which is convenient, because it means one investment serves both purposes.
Track citation share as a metric. Check whether your pages appear as sources in AI Overviews for your priority queries, and monitor it monthly. It is a crude measure, but visibility inside the answer is now part of the scoreboard whether or not it produces sessions.
Do not chase the informational traffic back. Rewriting fifty condition posts to recapture zero-click queries is the single most common wasted quarter in healthcare SEO right now.
Frequently asked questions
How do I know it is AI Overviews and not a penalty?
Penalties and ranking losses move your average position down and impressions with it. AI Overview interception leaves position and impressions intact or improving while clicks fall. Confirm by checking whether your declining queries actually trigger a summary.
Will the traffic come back?
Informational traffic to condition content, no. The studies show no sign of click-through recovery, though early 2026 data suggests the decline may be stabilizing rather than continuing to deepen. Commercial and local traffic is a different story and is defensible.
Should I block AI Overviews from using my content?
Blocking generally removes you from citation without restoring clicks, since the summary will be built from other sources. Most practices are better served by competing to be cited.
How do I get cited in AI Overviews?
Answer the question directly and early on the page, structure content clearly, show author credentials, cite primary sources, and keep the information current. Notably, citations do not correlate tightly with top-ten organic rankings, so a page that ranks modestly can still be cited.
Is this affecting Google Ads too?
Paid results still appear, and search intent has not disappeared, so campaigns targeting service and location queries continue to work. If anything, the compression of organic informational traffic makes paid capture of commercial intent more valuable.
What should I report to the practice owner now?
Booked appointments and cost per new patient by channel. Sessions and pageviews have become misleading as headline metrics, and a practice judging its marketing by traffic will draw the wrong conclusion in both directions.
The bottom line
Falling clicks with stable rankings is a diagnosis, not a disaster. Split your data, accept that informational traffic is structurally gone, and put the effort into the commercial and local queries that AI summaries cannot answer. Then change what you report, because measuring a 2026 medical practice on sessions is measuring the wrong thing entirely.
The practices that panic will spend the year rewriting content nobody was going to click. The ones that diagnose properly will spend it owning the queries that produce appointments.
CGColors runs this diagnosis for medical practices and rebuilds around what still converts: commercial and local query coverage, citation-ready content structure, and reporting built on booked patients rather than pageviews. That is how a practice stays found first, called first, booked first.